
Google Sheets — Ecommerce Catalog Data Operations
Hands-on catalog workflows in Google Sheets for cleaning, validating, enriching, and auditing product data.
Overview
In this case study, I use Google Sheets to manage a realistic ecommerce product catalog end-to-end. The same workflow applies in Excel, but I chose Google Sheets here to keep the file shareable and easy to review.
I clean messy vendor data, enforce controlled inputs, validate product attributes, audit data quality, enrich records at scale, and prepare import-ready files for Shopify or PIM systems. The work reflects how I operate day-to-day on catalog data, with a focus on accuracy, consistency, and reliable downstream use.
Jump to Section
You can view the complete Google Sheets workbook used for this case study below.
1. Product Catalog Master Sheet
This section shows how I structure a product catalog in a spreadsheet using a realistic but intentionally messy dataset. The goal is to demonstrate how I separate raw data from a working sheet, apply basic controls, and make data issues visible before any cleanup or correction work.
Figure 1.1. Catalog Working Sheet
Working catalog sheet created from a raw product feed. The data is intentionally not cleaned yet, so missing values, inconsistent labels, and pricing issues are still present.
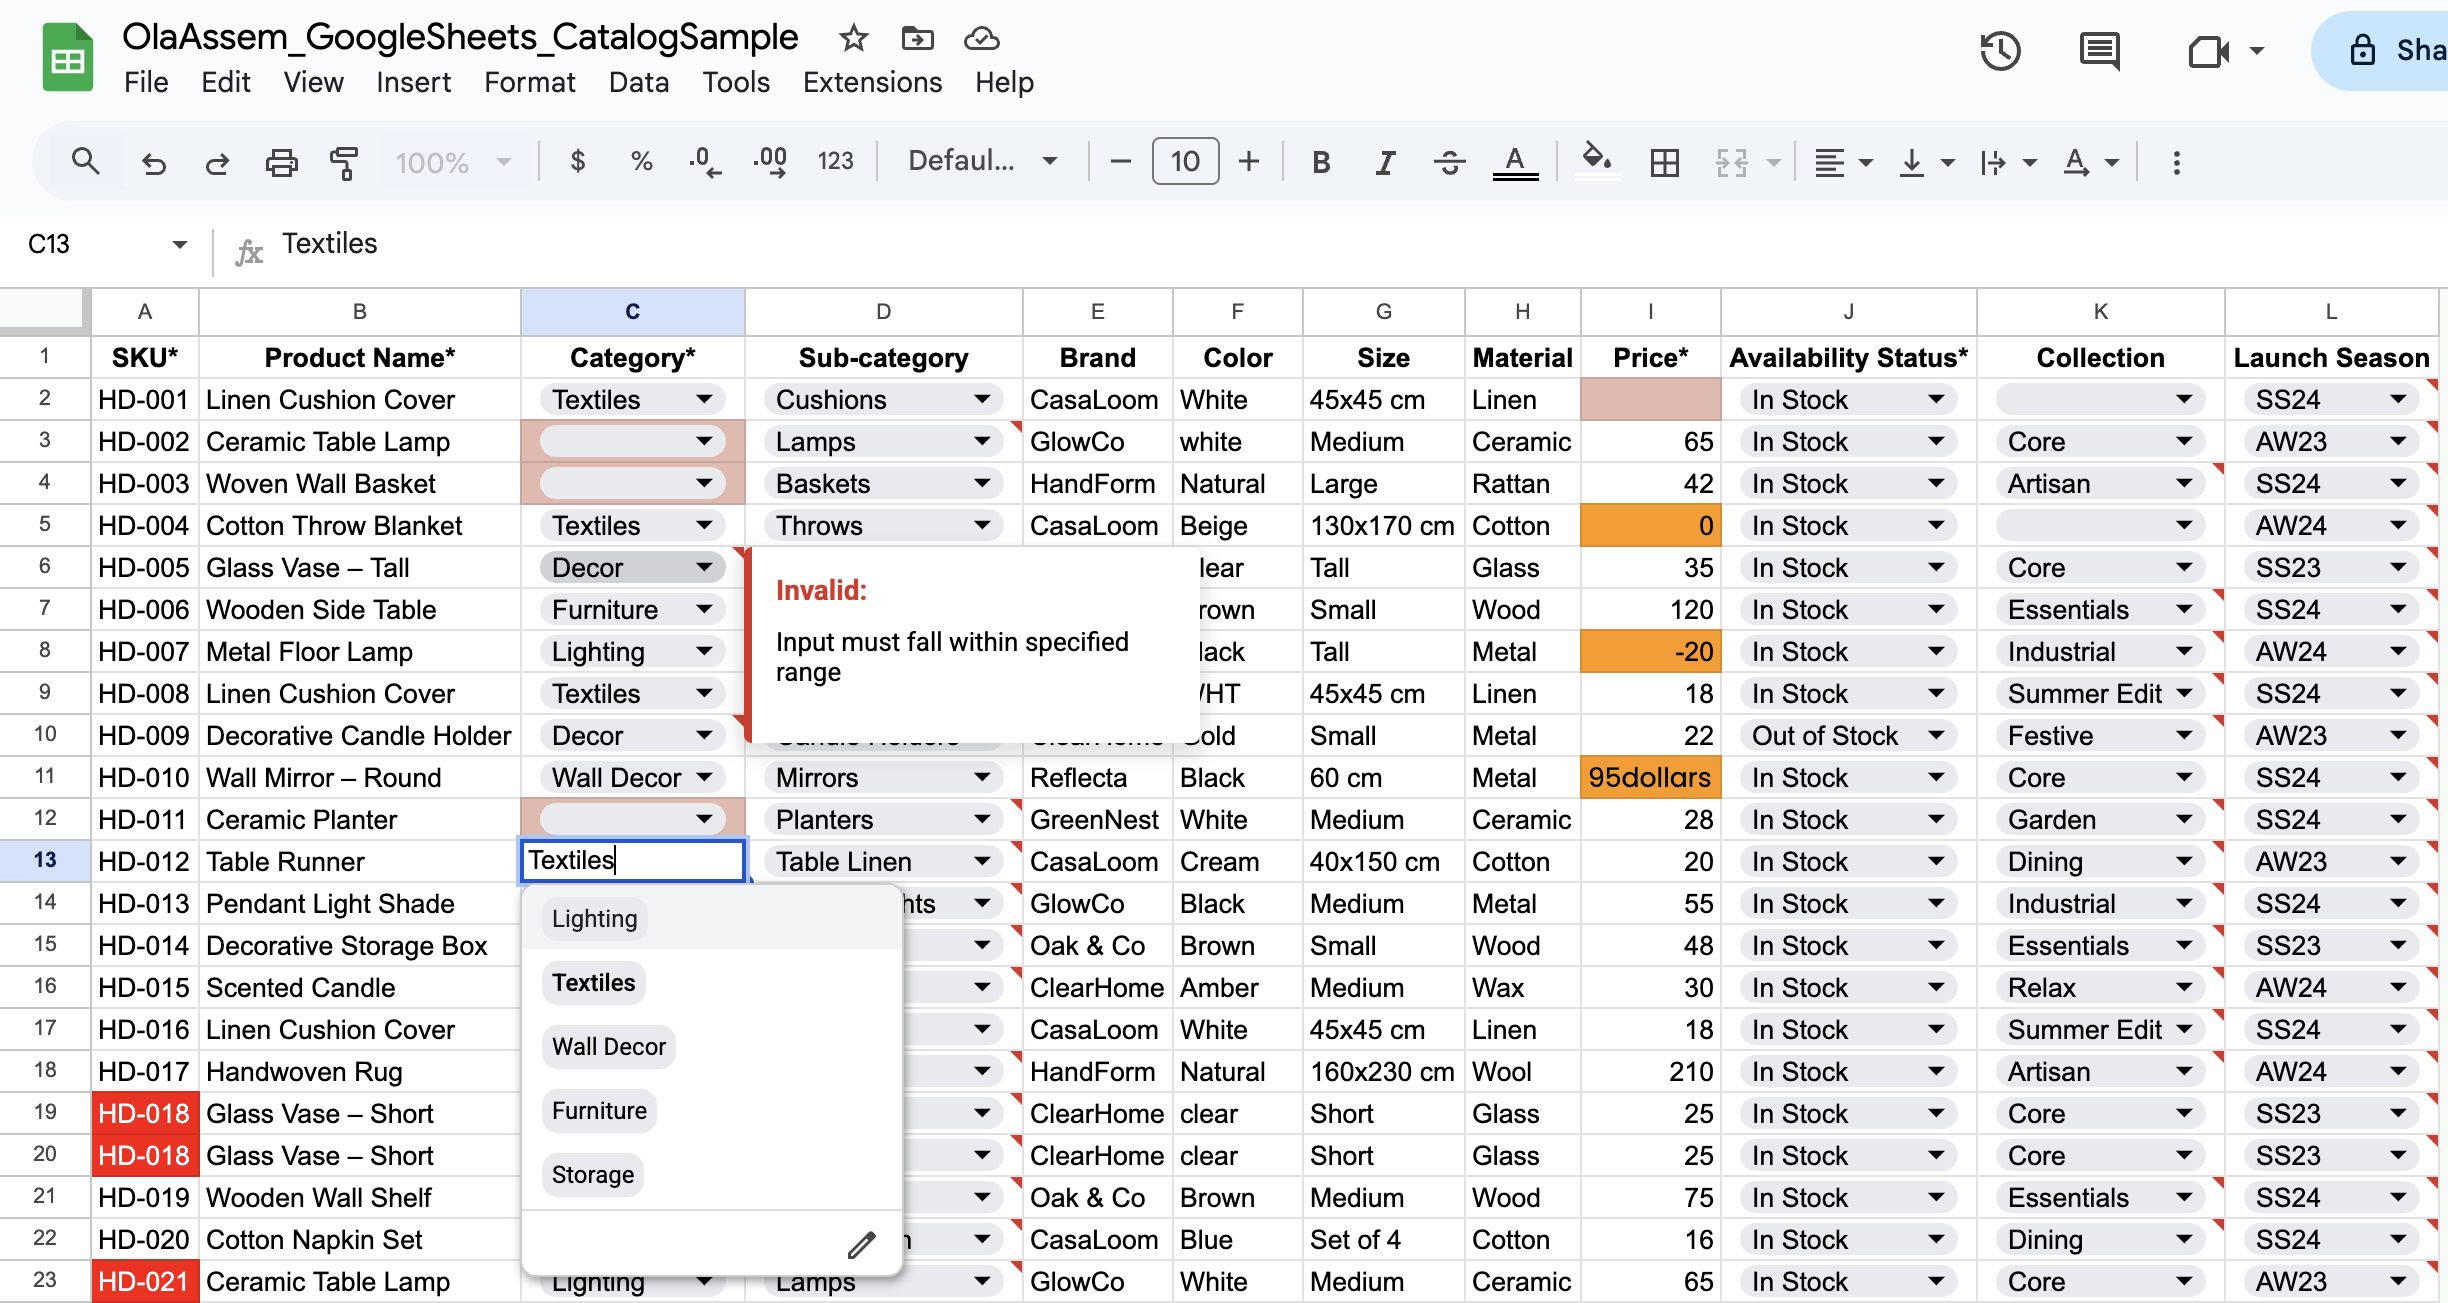
Figure 1.2. Data Validation (Dropdown Rules)
Dropdown validation added to required catalog columns, pulling allowed values from central reference lists. Invalid or inconsistent existing entries were preserved to make data issues visible rather than auto-corrected.
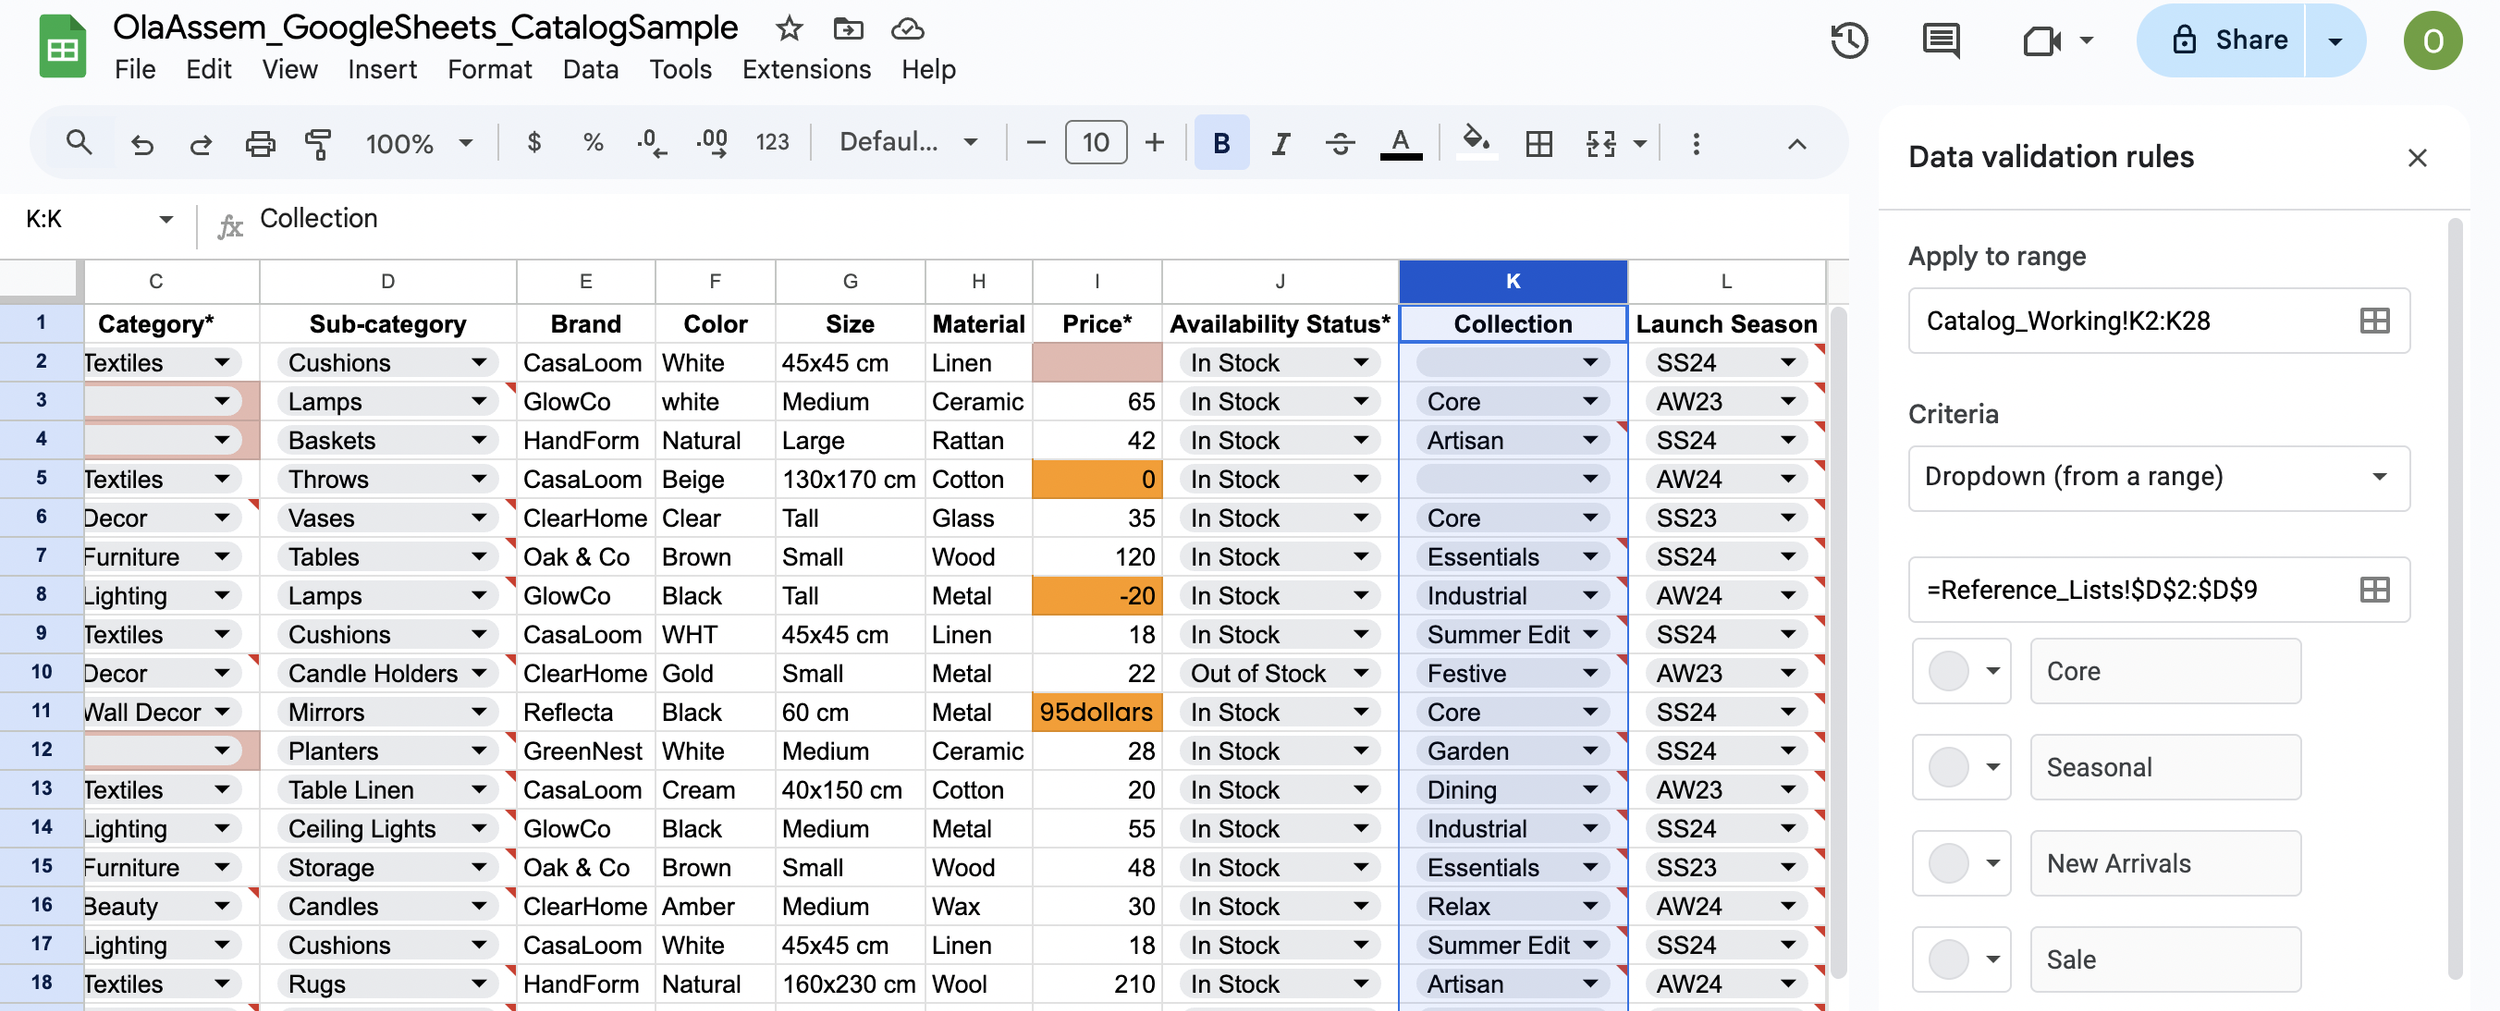
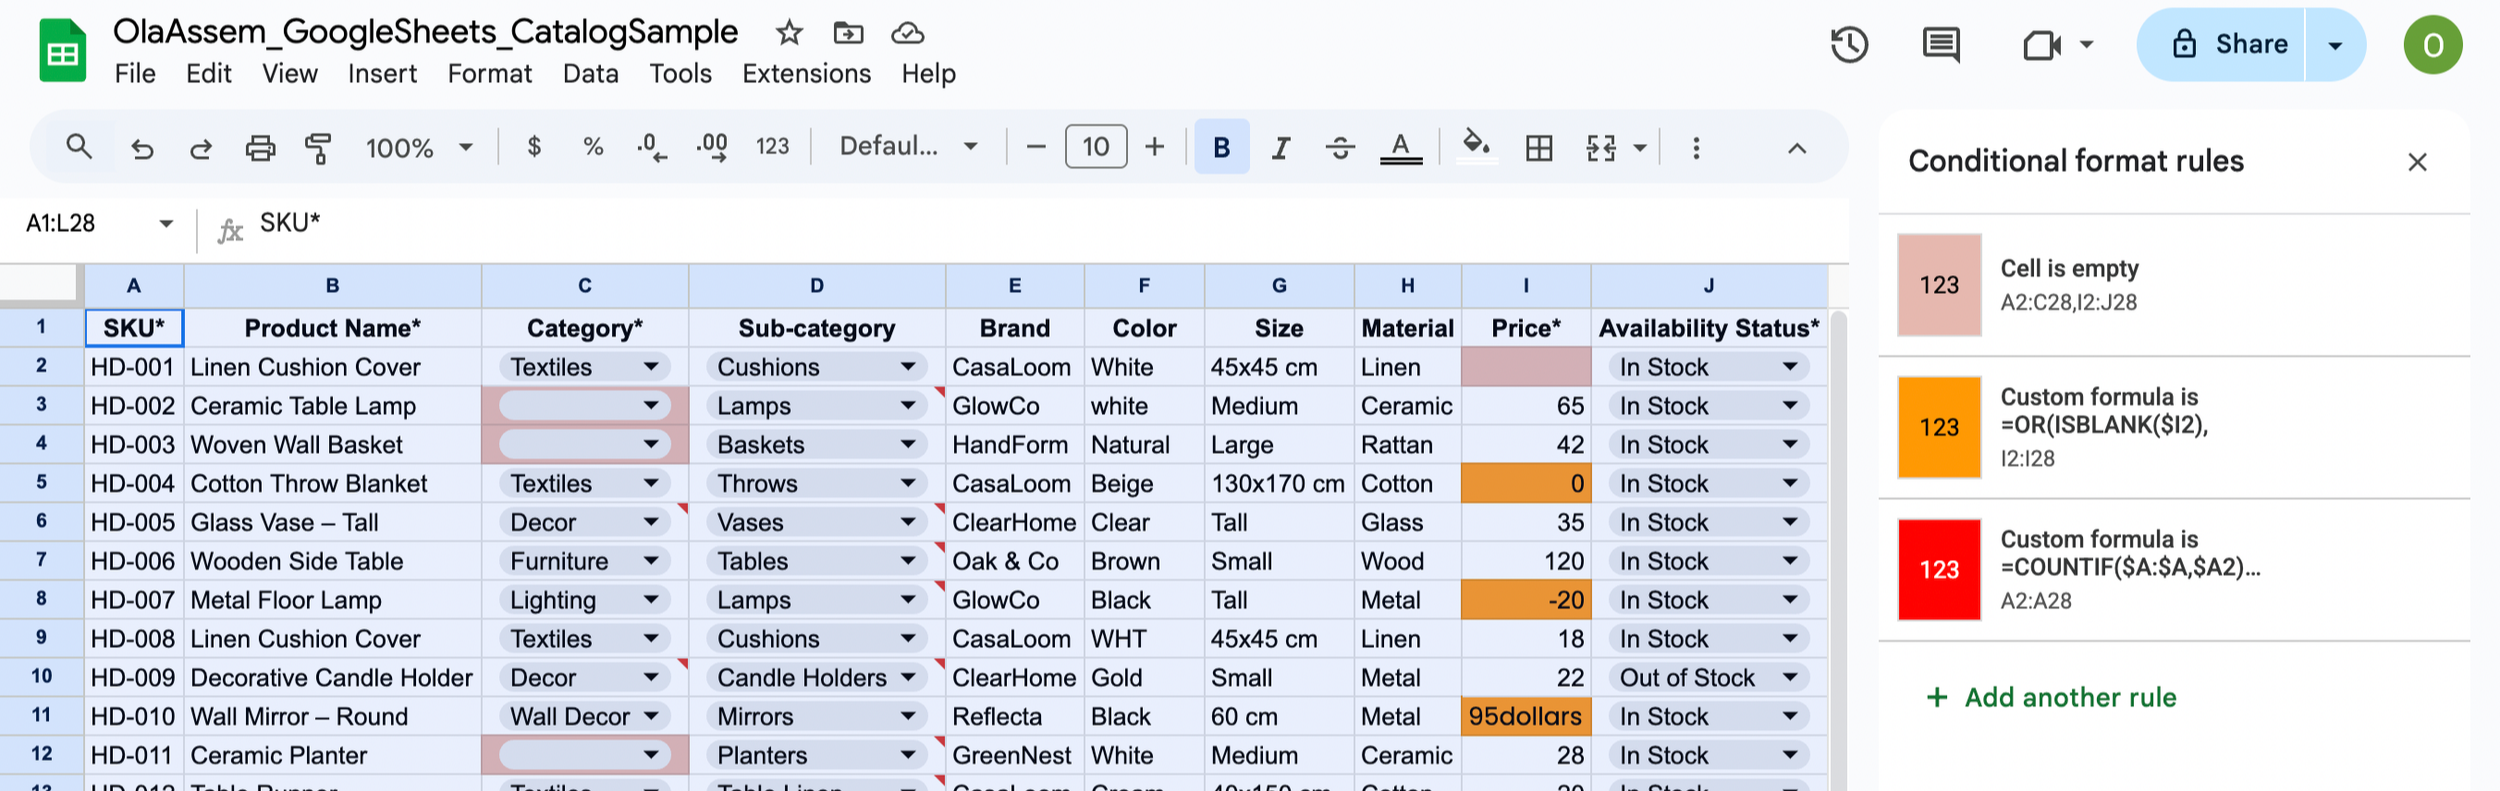
Figure 1.3. Conditional Formatting (Data Issues Highlighted)
Conditional formatting used to visually flag problems in the data, such as missing required fields, duplicate SKUs, and invalid prices (without fixing them yet).
2. Catalog QA Audit (Issue Flagging in Google Sheets)
This section shows how I audit a working product catalog for common QA issues using Google Sheets checks. The goal is to surface problems that block clean merchandising and publishing—duplicate SKUs, invalid reference values, missing required fields, and pricing errors—so they can be reviewed and resolved systematically.
Figure 2.1a. Duplicate SKU (Filter View)
A filter view isolates rows flagged as Duplicate SKU. This makes duplicate identifiers easy to review without altering the dataset.

Figure 2.1b. Duplicate SKU (QA Flag Formula)
An IF + COUNTIF check flags SKUs that appear more than once in the defined range. This highlights duplicate product identifiers for cleanup or merge decisions.
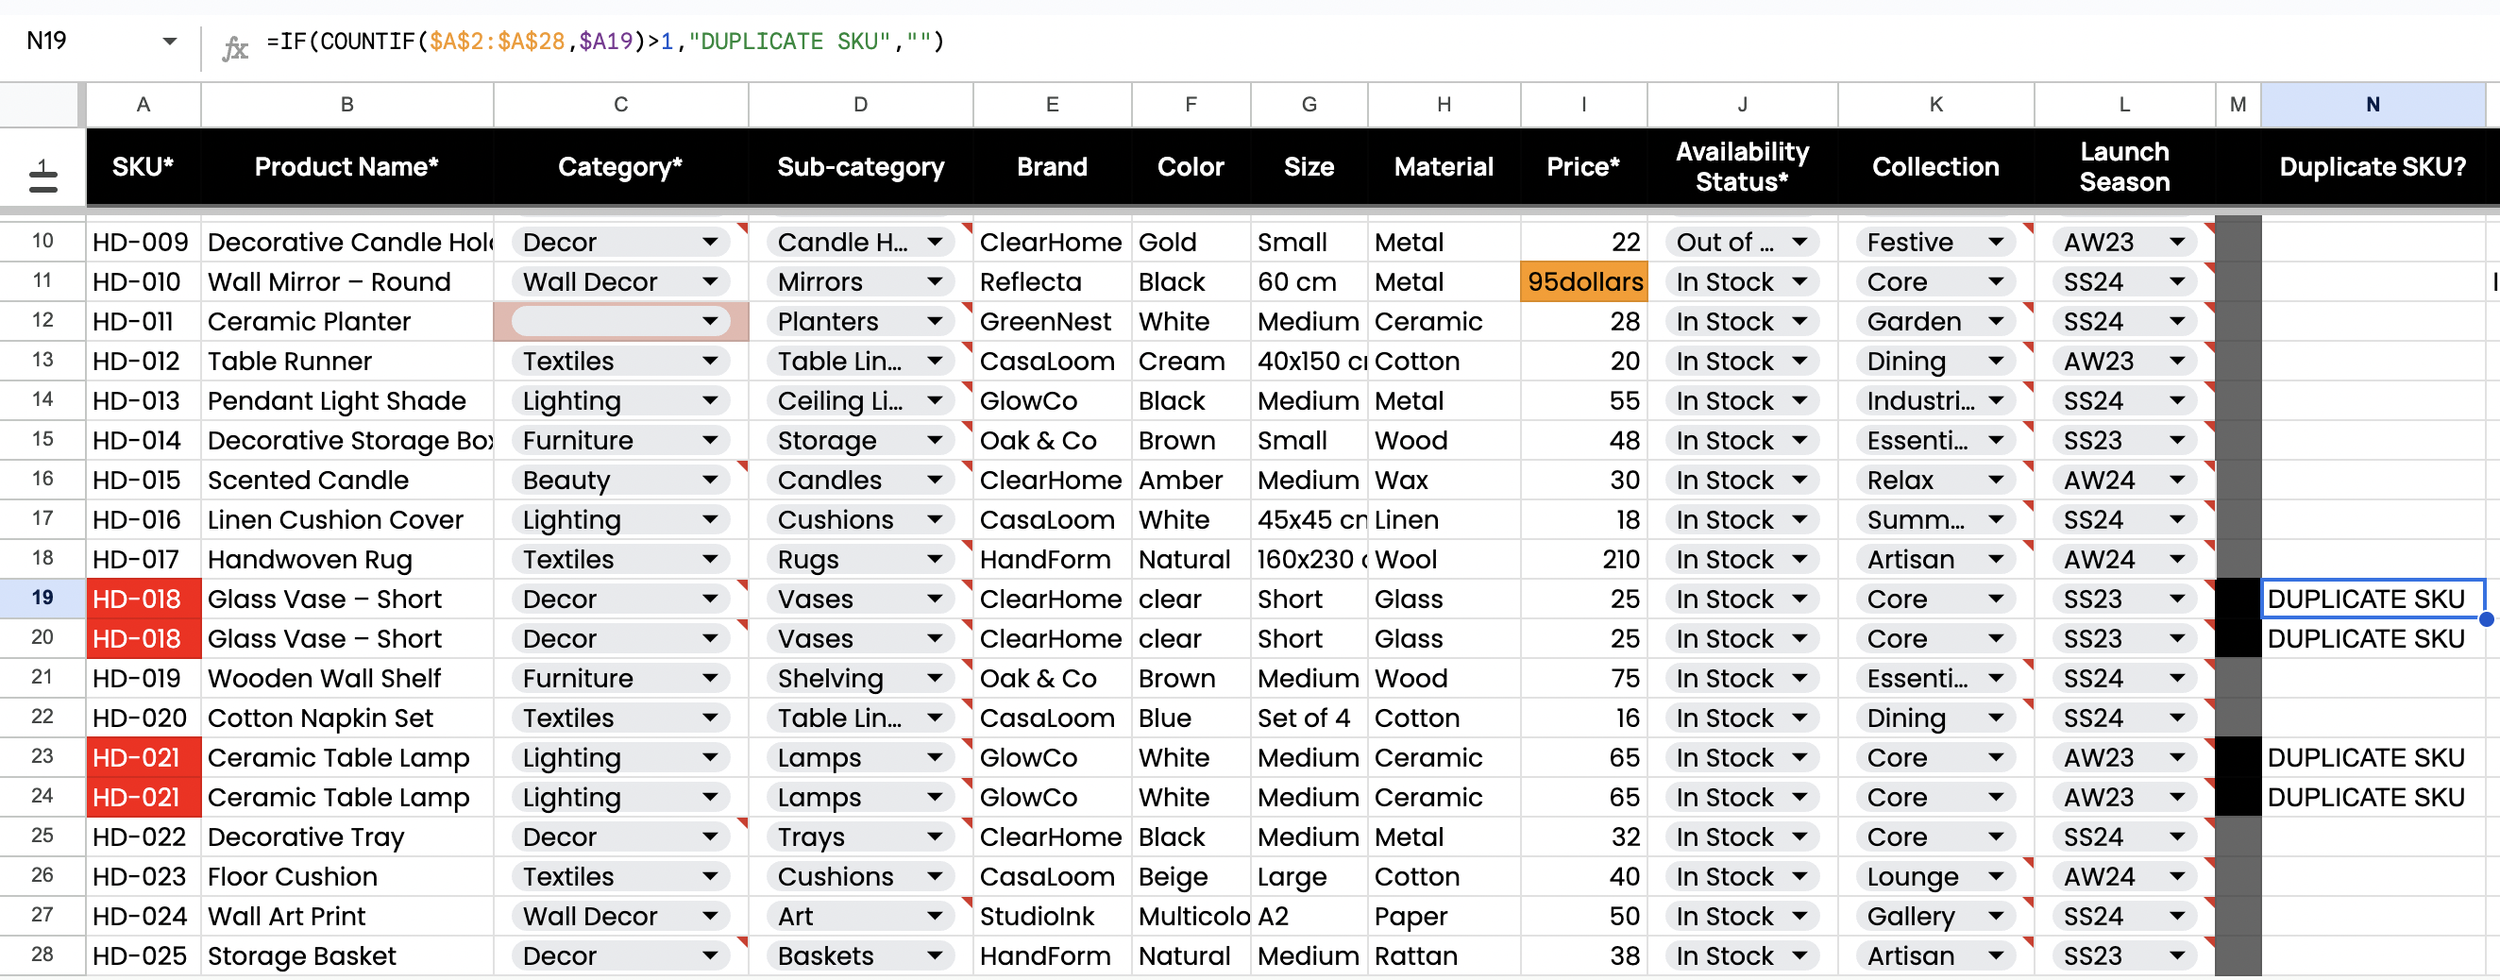
Figure 2.2. Invalid Price (QA Flag Formula)
An IF + OR check flags prices that are blank, non-numeric, or less than or equal to zero. This highlights pricing errors before any correction work.
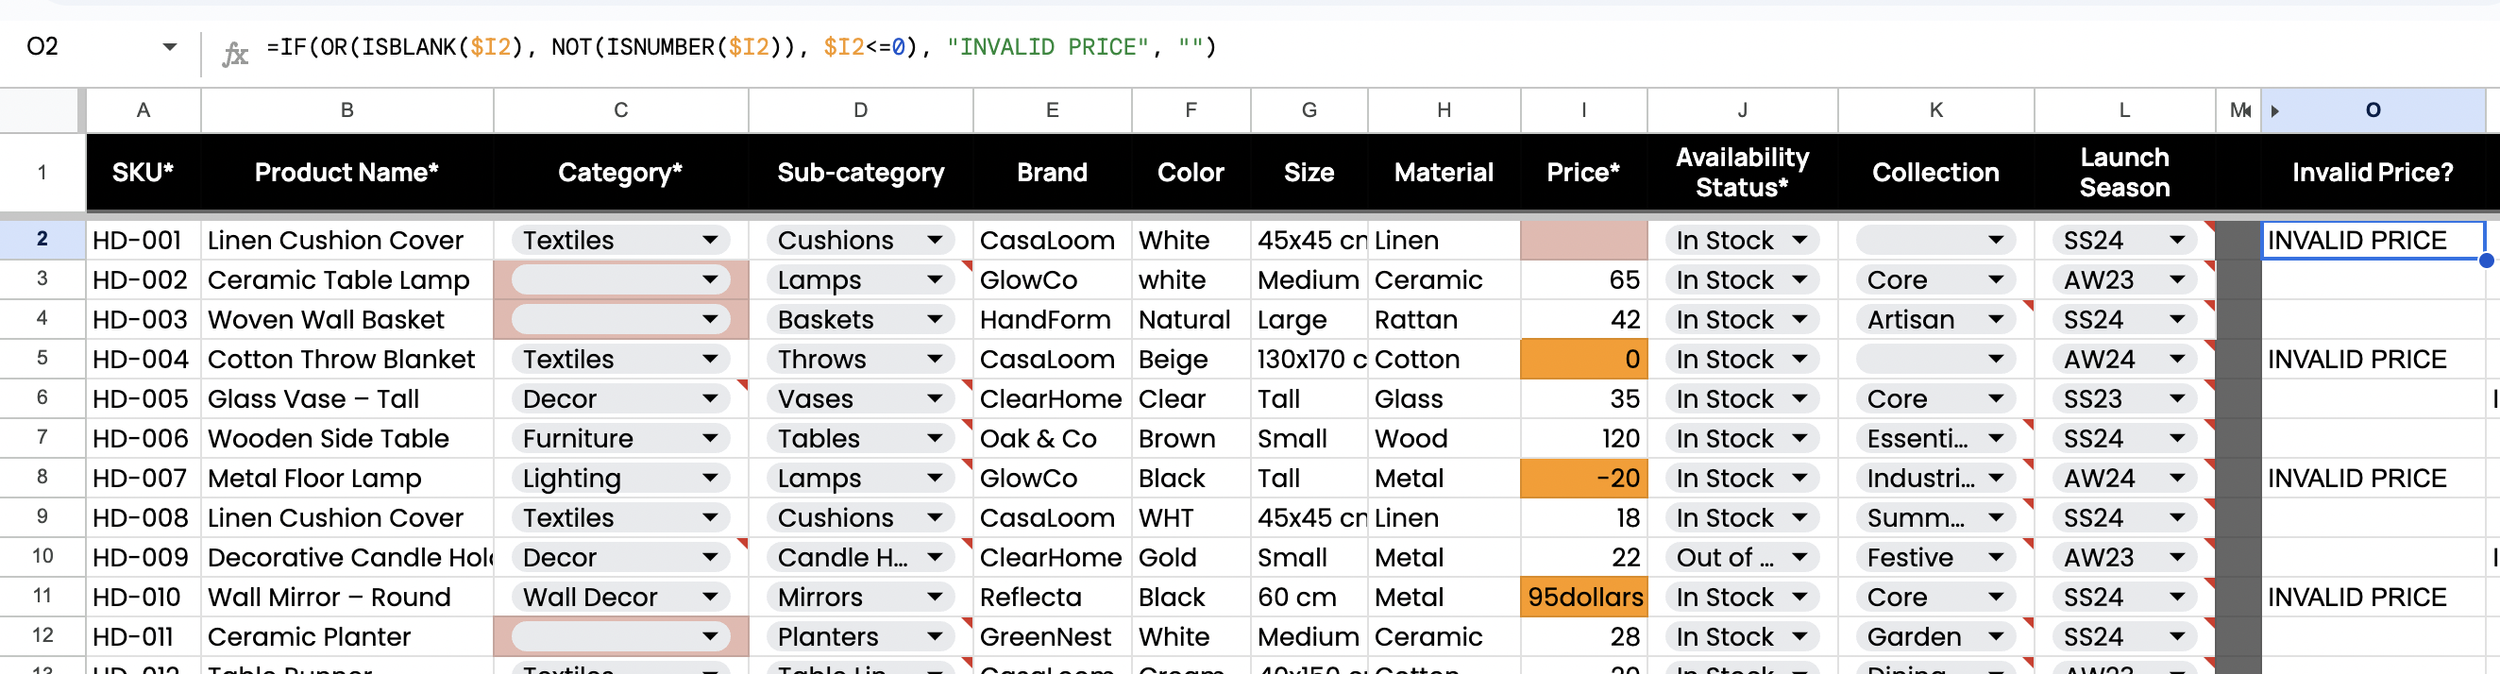
Figure 2.3. Invalid Category (QA Flag Formula)
A COUNTIF lookup against Reference_Lists flags category values that are not in the approved list. This highlights taxonomy values that will break consistency across the catalog.
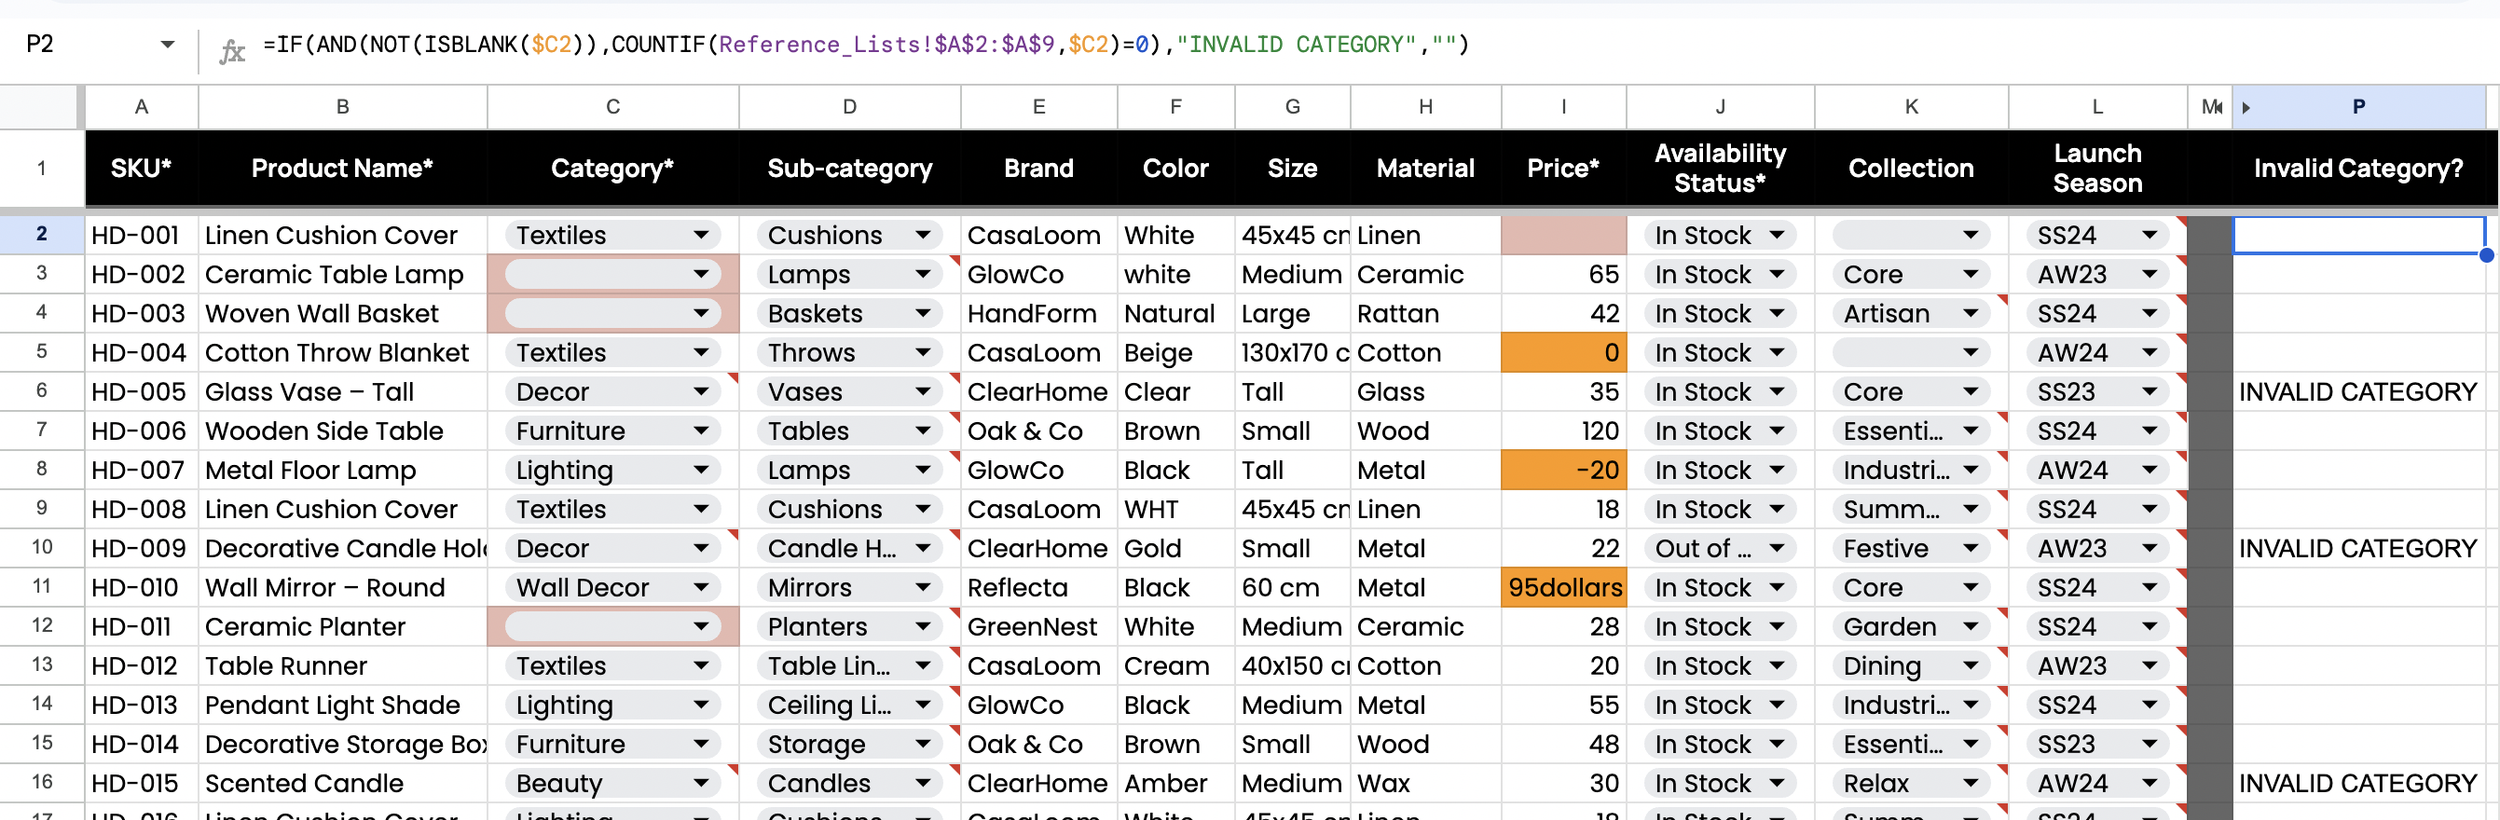
Figure 2.4. Invalid Availability (QA Flag Formula)
A COUNTIF lookup against Reference_Lists flags availability values that are not in the approved list. This highlights status values that can cause incorrect storefront messaging.
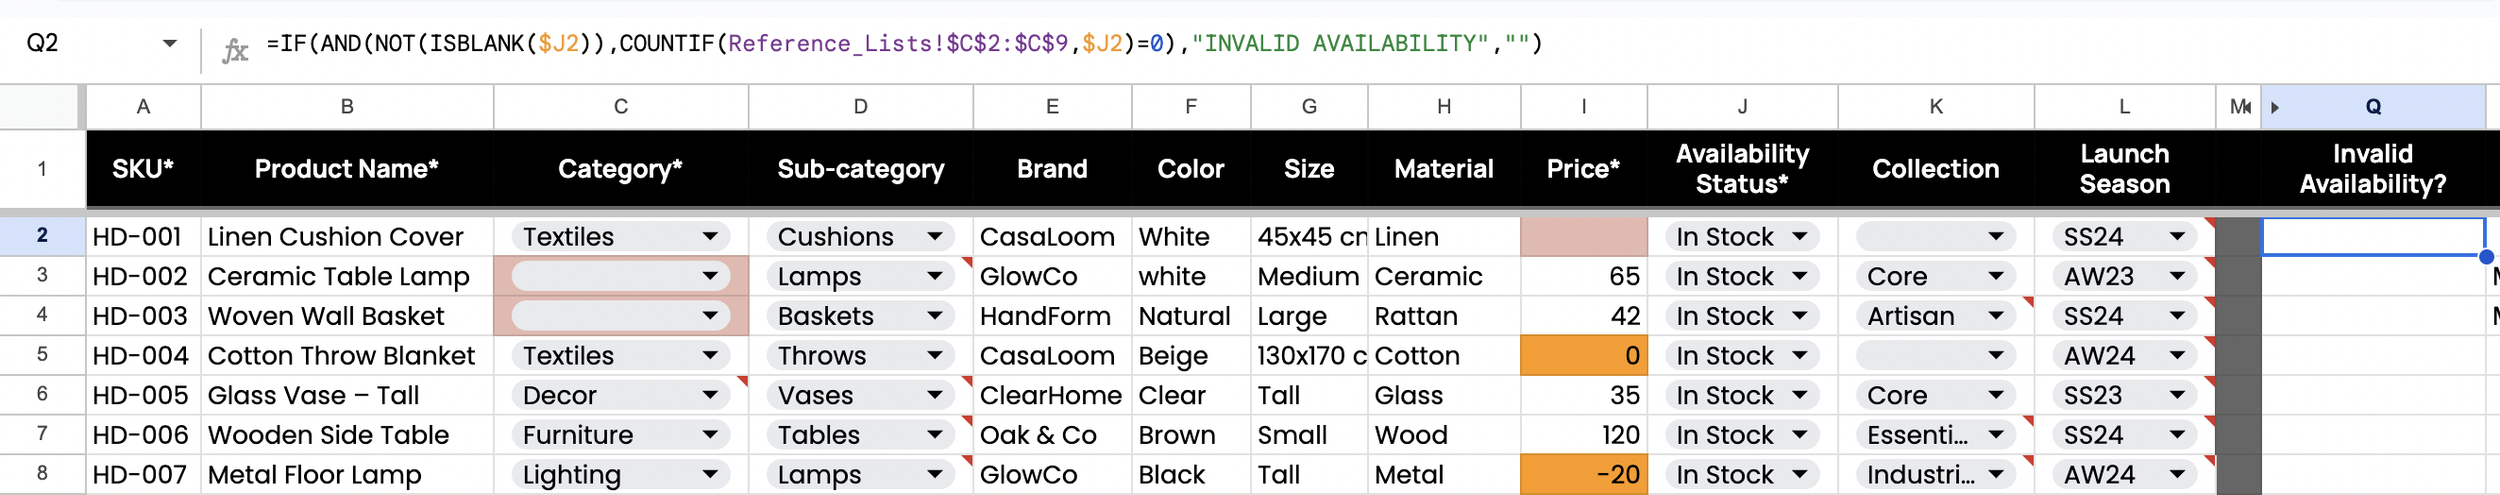
Figure 2.5. Missing Category (QA Flag Formula)
An ISBLANK check flags rows with no category value. This highlights missing required classification separate from invalid entries.
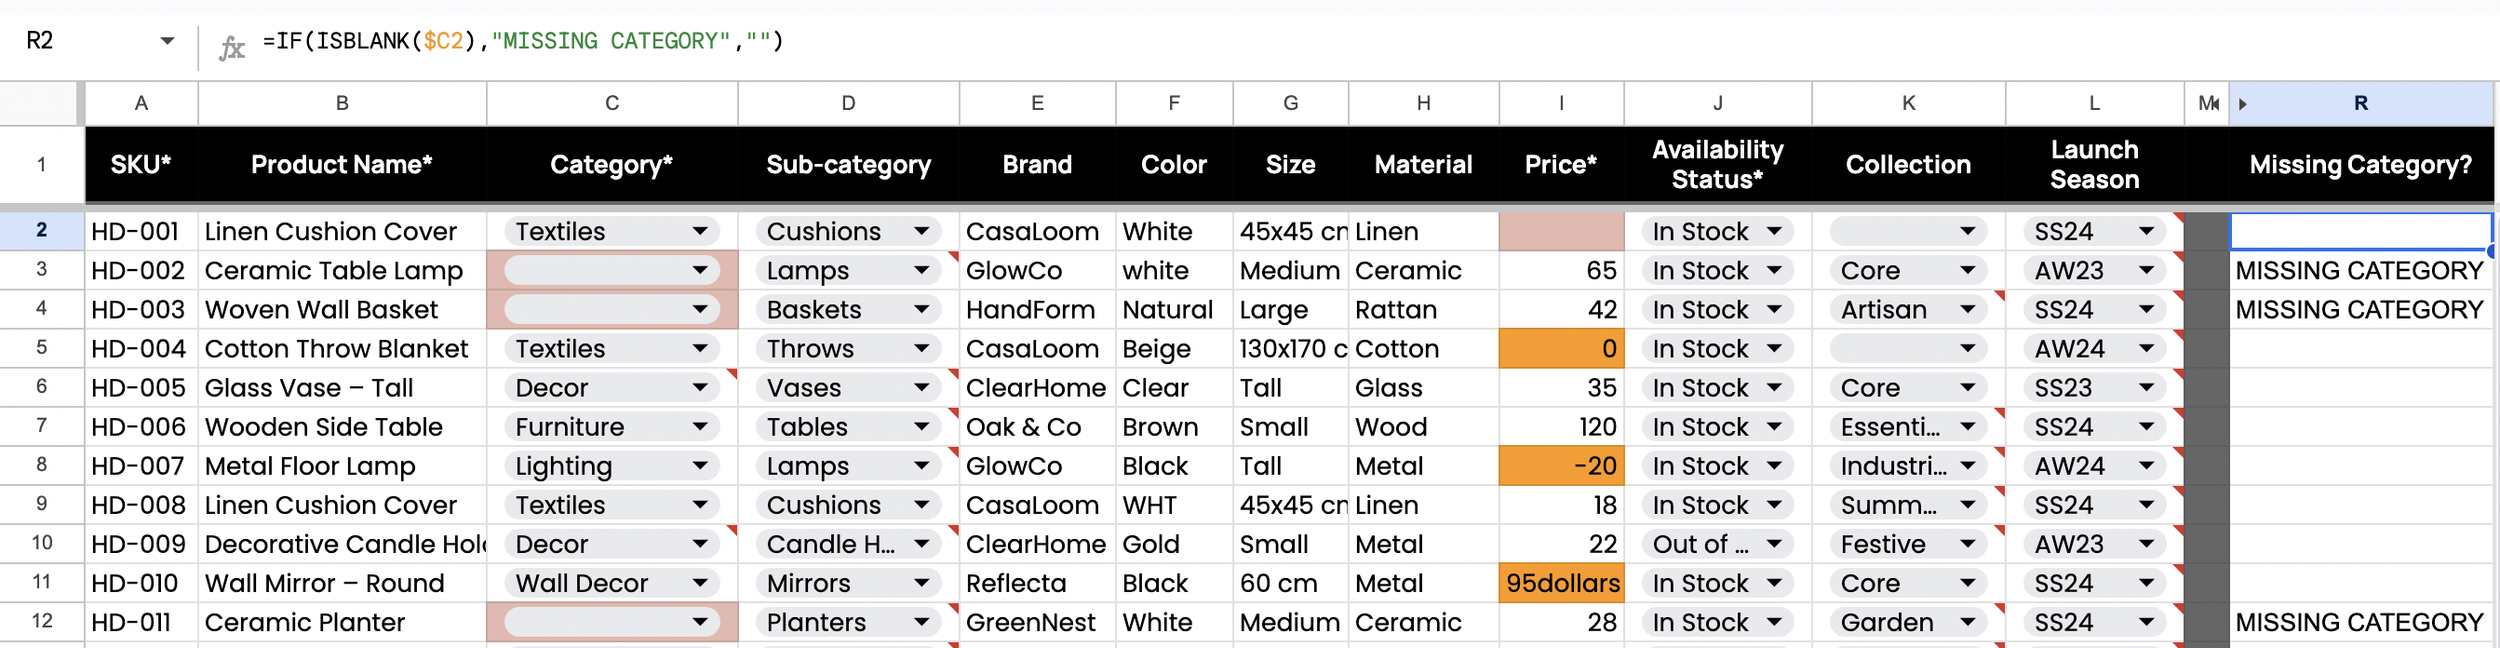
Figure 2.6. Missing Collection (QA Flag Formula)
An ISBLANK check flags rows with no collection value. This highlights merchandising placement gaps that affect grouping and filtering.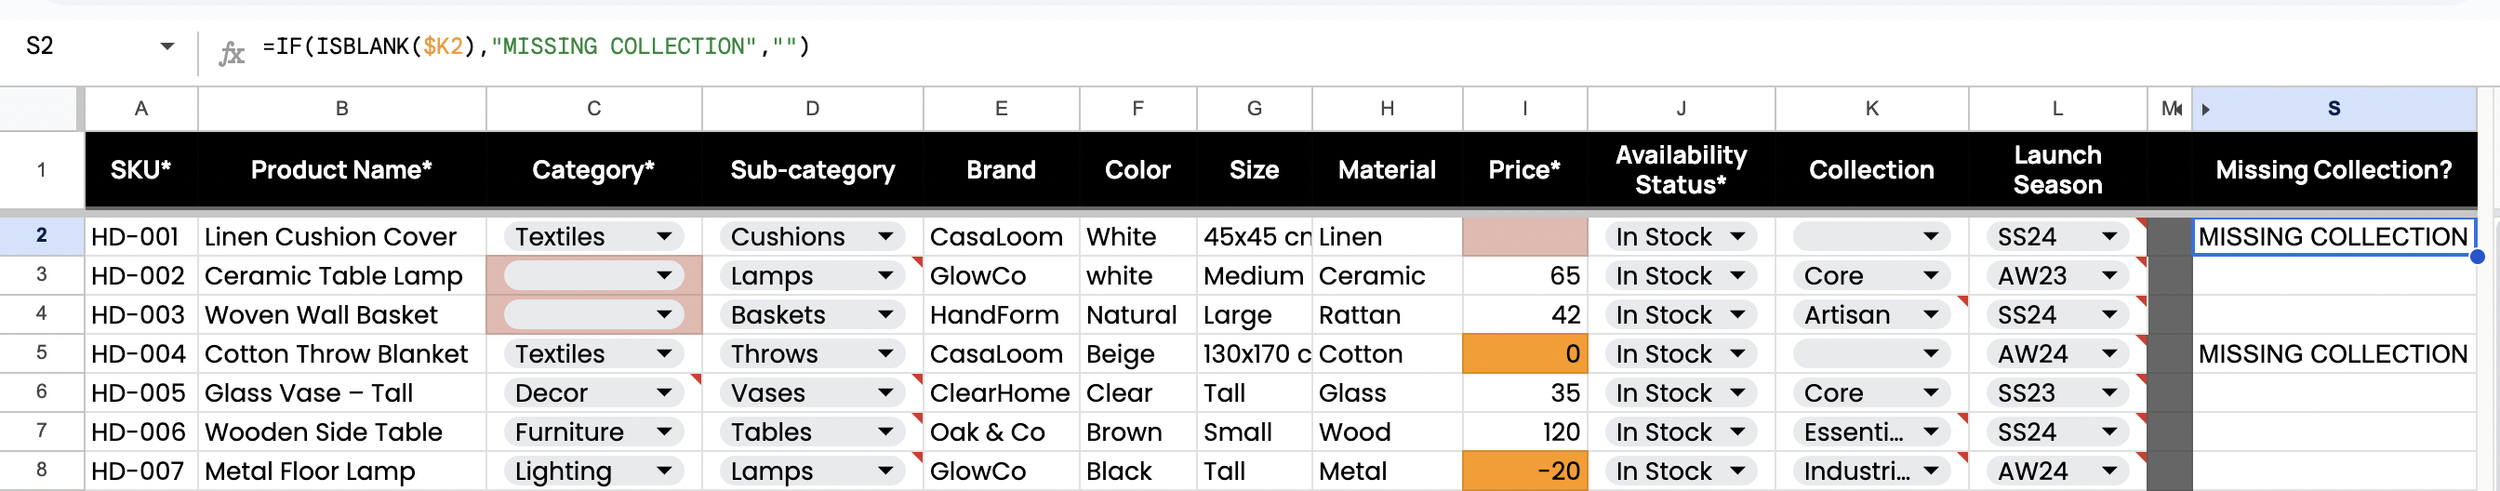
3. Attribute Coverage Audit (Completeness by Category)
This section measures attribute completeness across each approved category. The table summarizes the percentage of SKUs per category with Sub-category, Brand, Color, Size, Material, Collection, and Launch Season populated, making enrichment gaps easy to spot and prioritize by category and attribute.
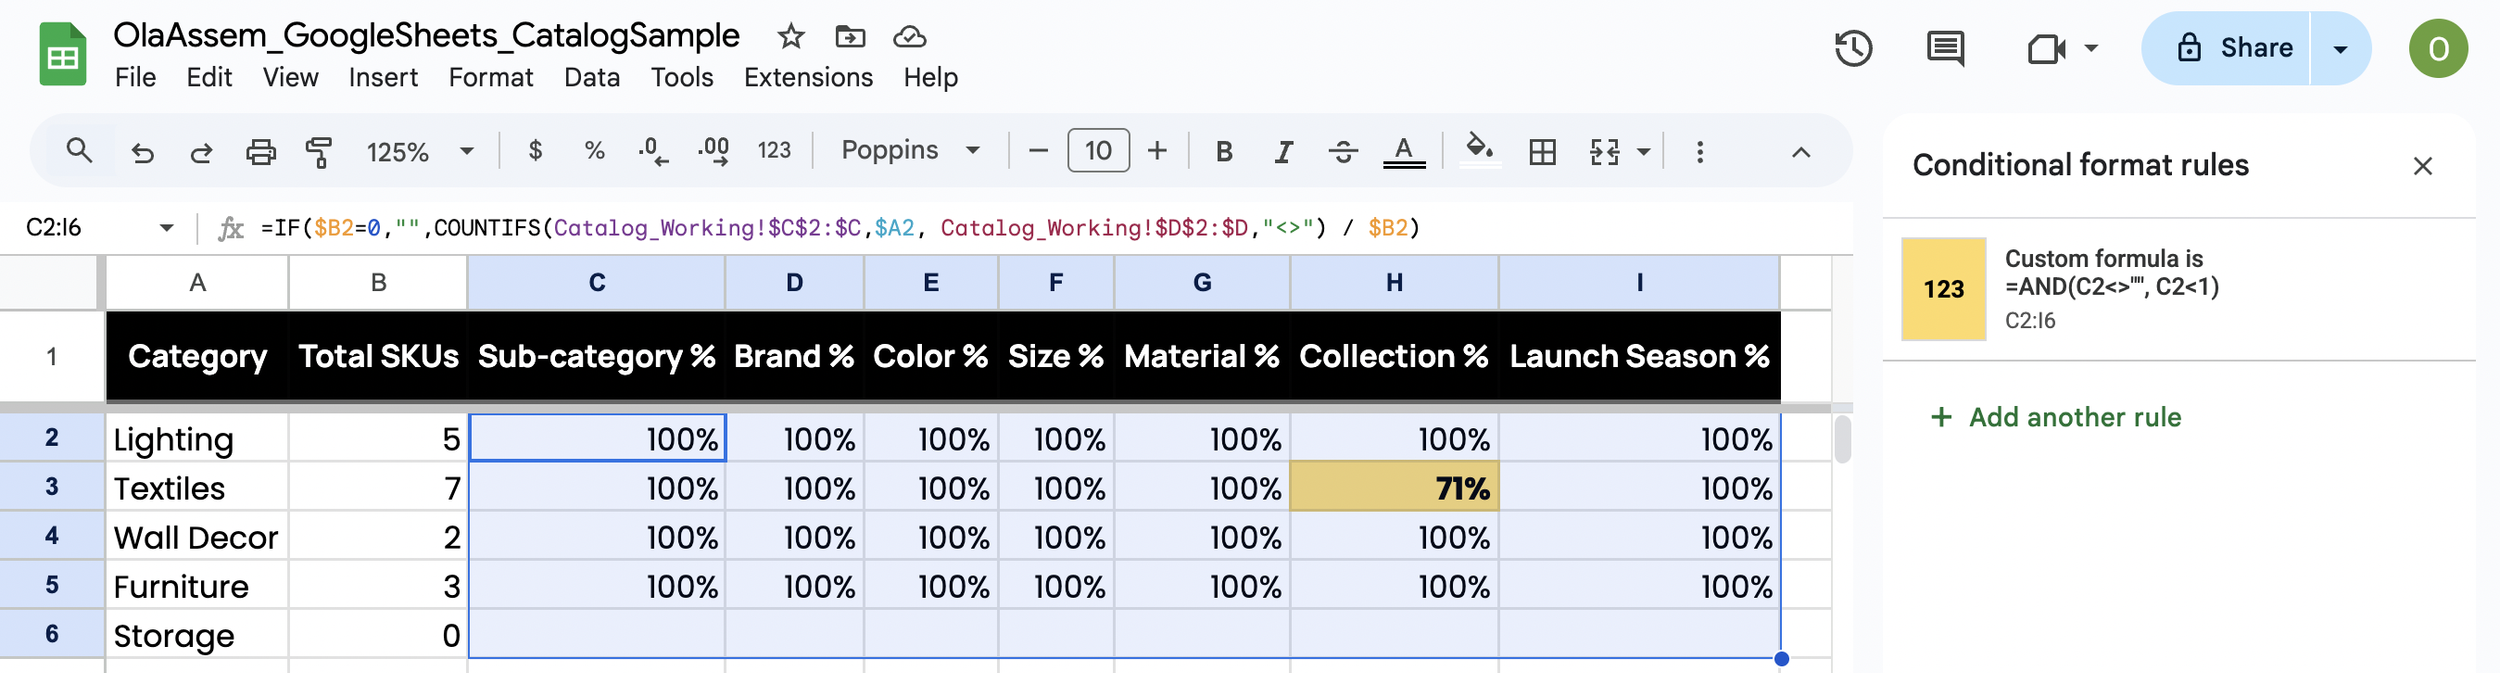
Figure 3.1. Attribute Coverage Audit Table
This table shows attribute completeness by category and highlights where enrichment is missing.
4. Pivot Table Performance Views
This section shows how I use pivot tables to summarize SKU performance and surface ecommerce actions without manual sorting. The goal is to create fast, reusable views for category reporting, top-seller ranking, and slow-mover identification using calculated metrics, filters, and slicers.
Figure 4.1a. Category Performance Summary (Pivot Table & Slicers)
This pivot table aggregates Net Sales, Units Sold, and Average Unit Revenue by Category and Sub-category. Collection and Availability Status slicers allow quick segmentation without editing formulas.

Figure 4.1b. Category Pivot Table Setup
This view documents the pivot table configuration used to group by Category and Sub-category and sort results by Net Sales in descending order.

Figure 4.2a. Best-Selling SKUs (Ranked by Net Sales)
This pivot table ranks SKUs by Net Sales and includes Units Sold and average Weeks of Supply to connect revenue performance to inventory efficiency.
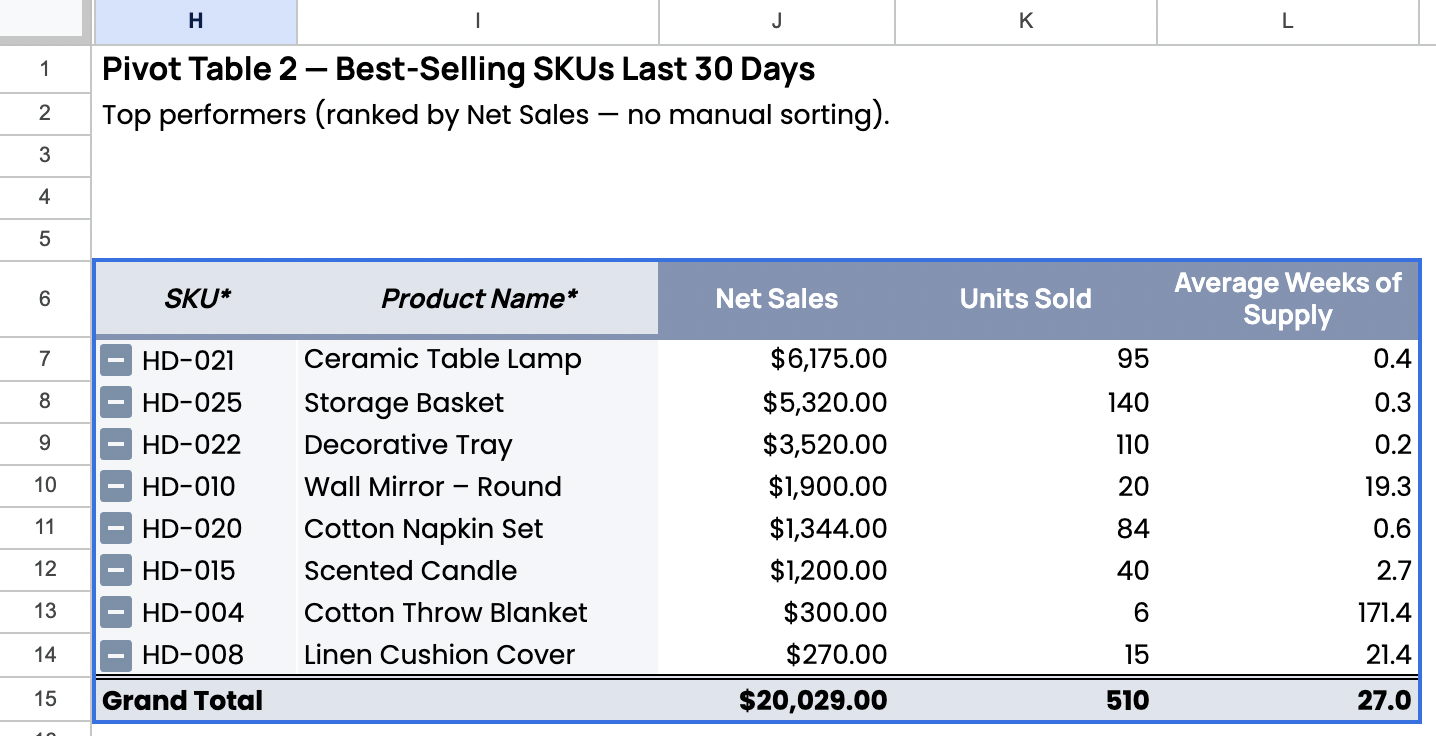
Figure 4.2b. Best-Seller Pivot Table Setup
This view documents the pivot table sorting logic and the filter used to prevent Average Weeks of Supply calculation errors so the ranking stays stable.
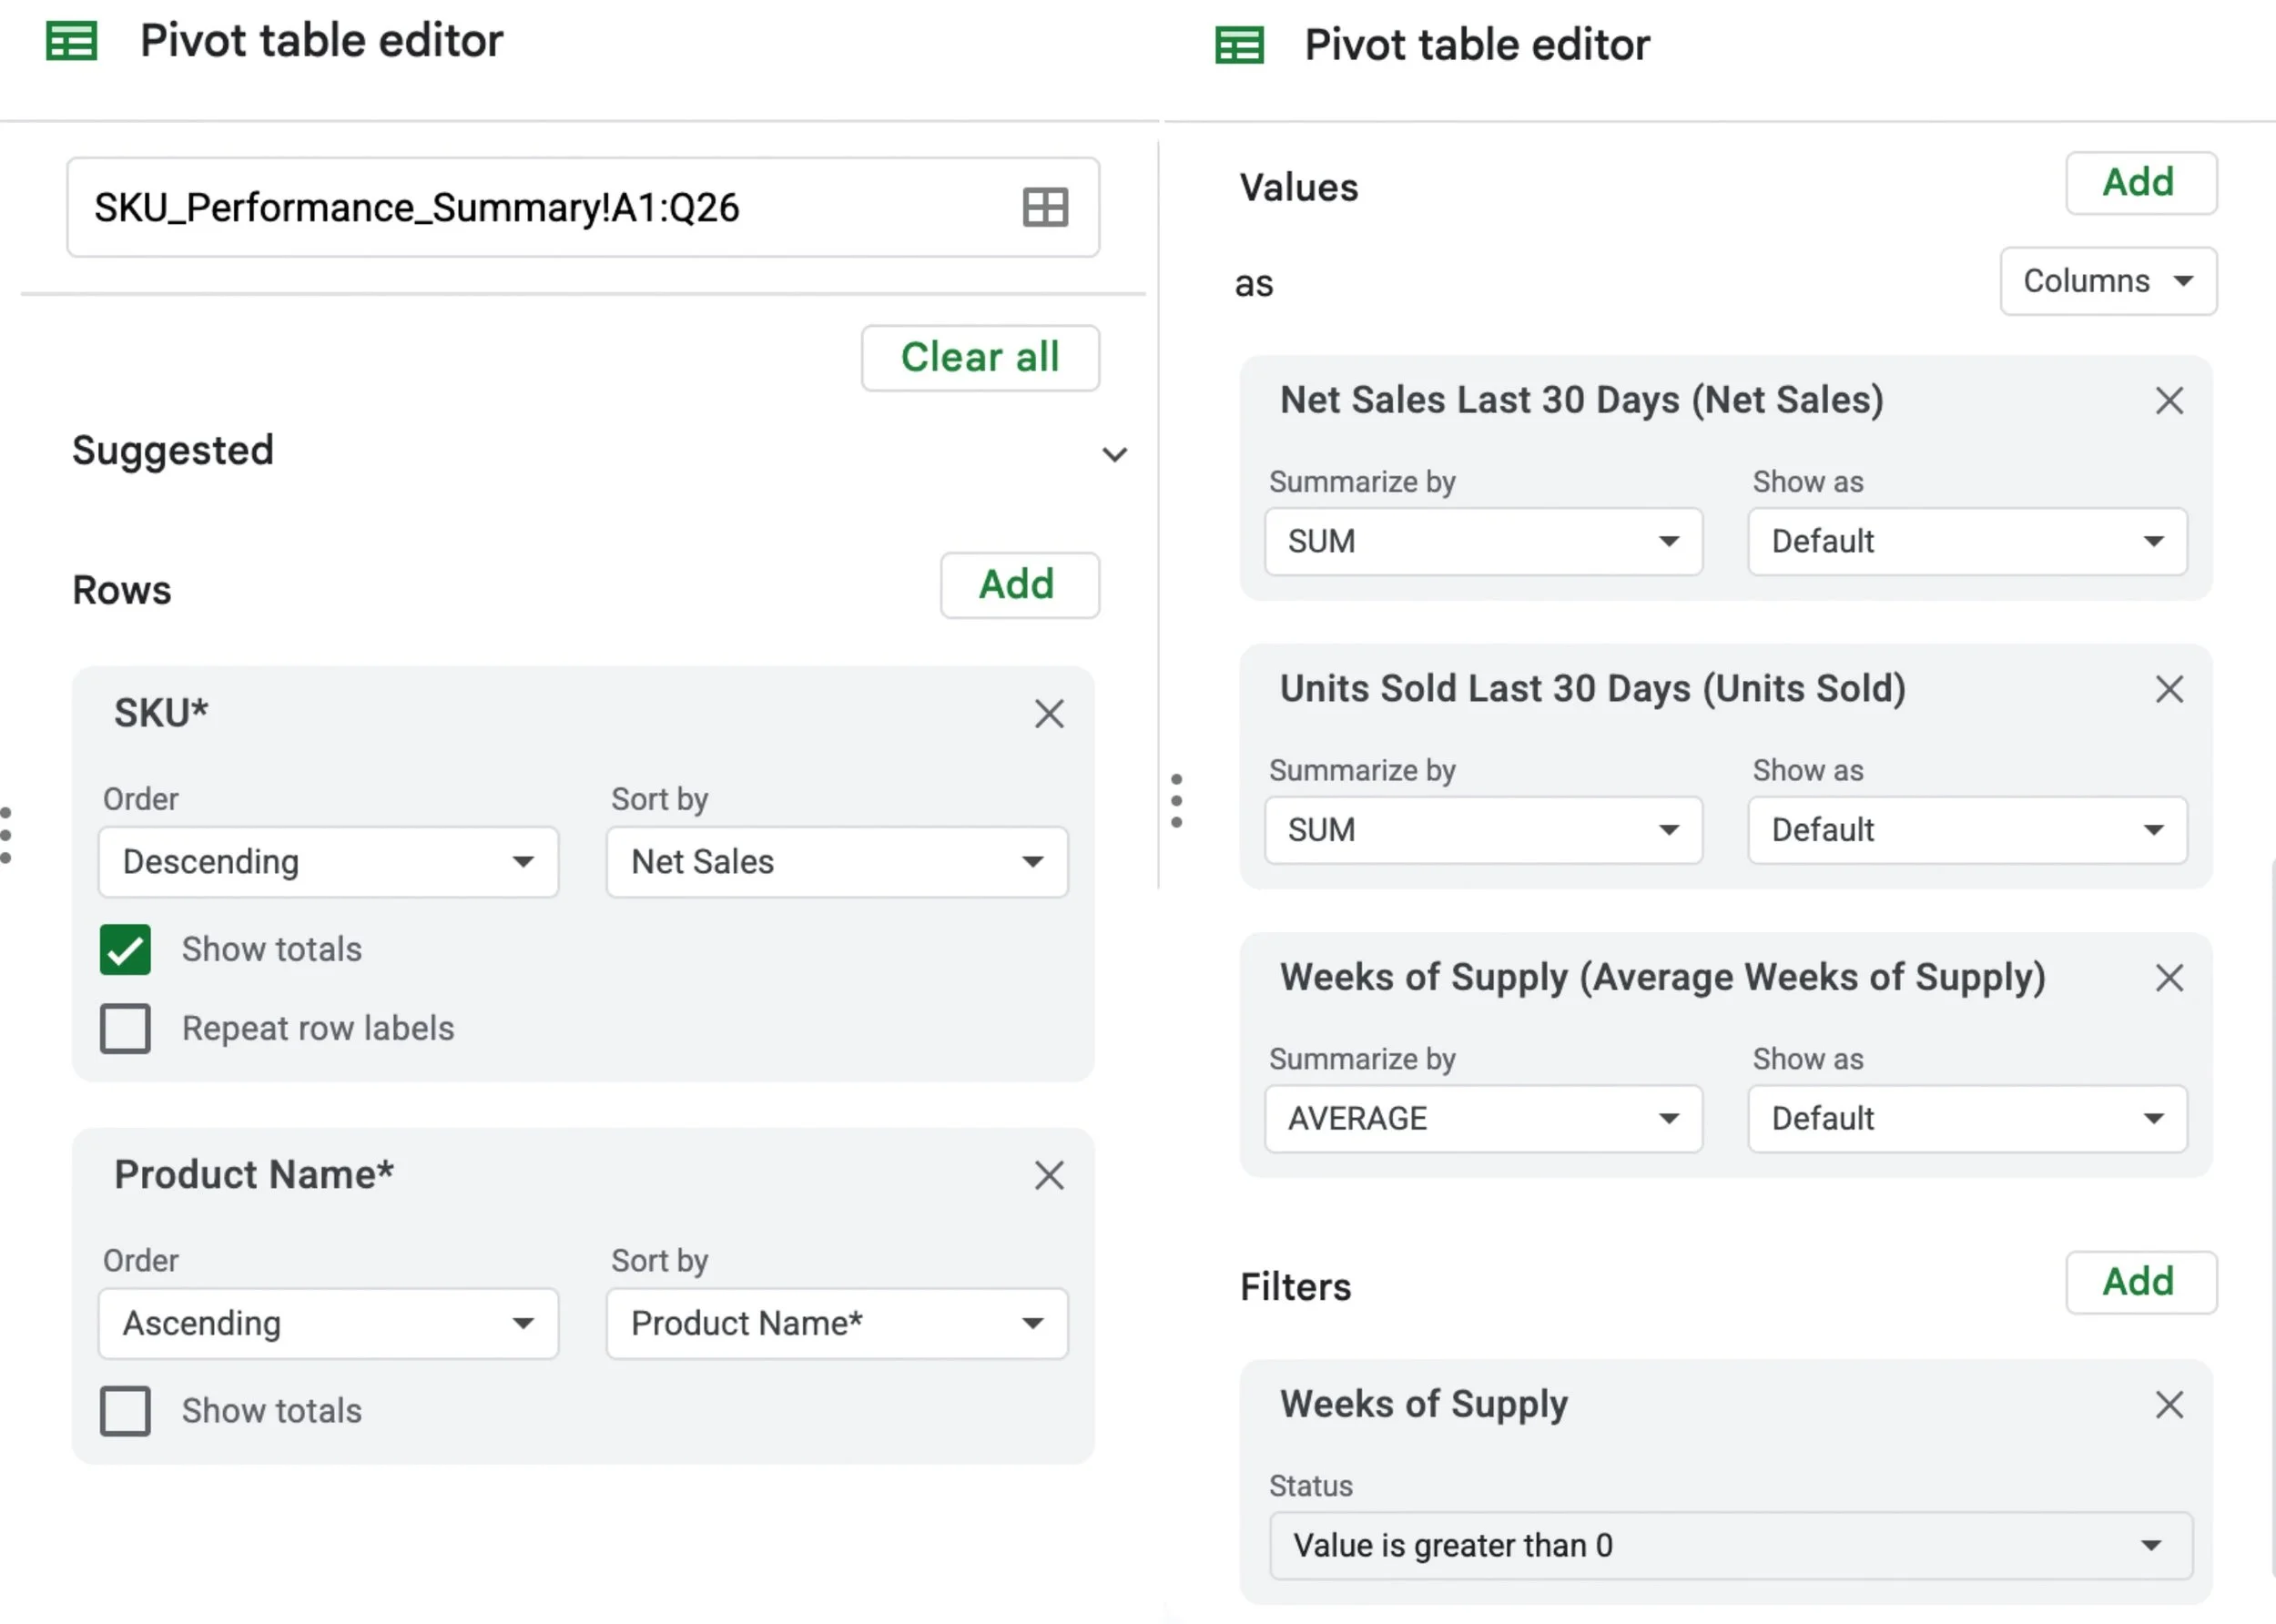
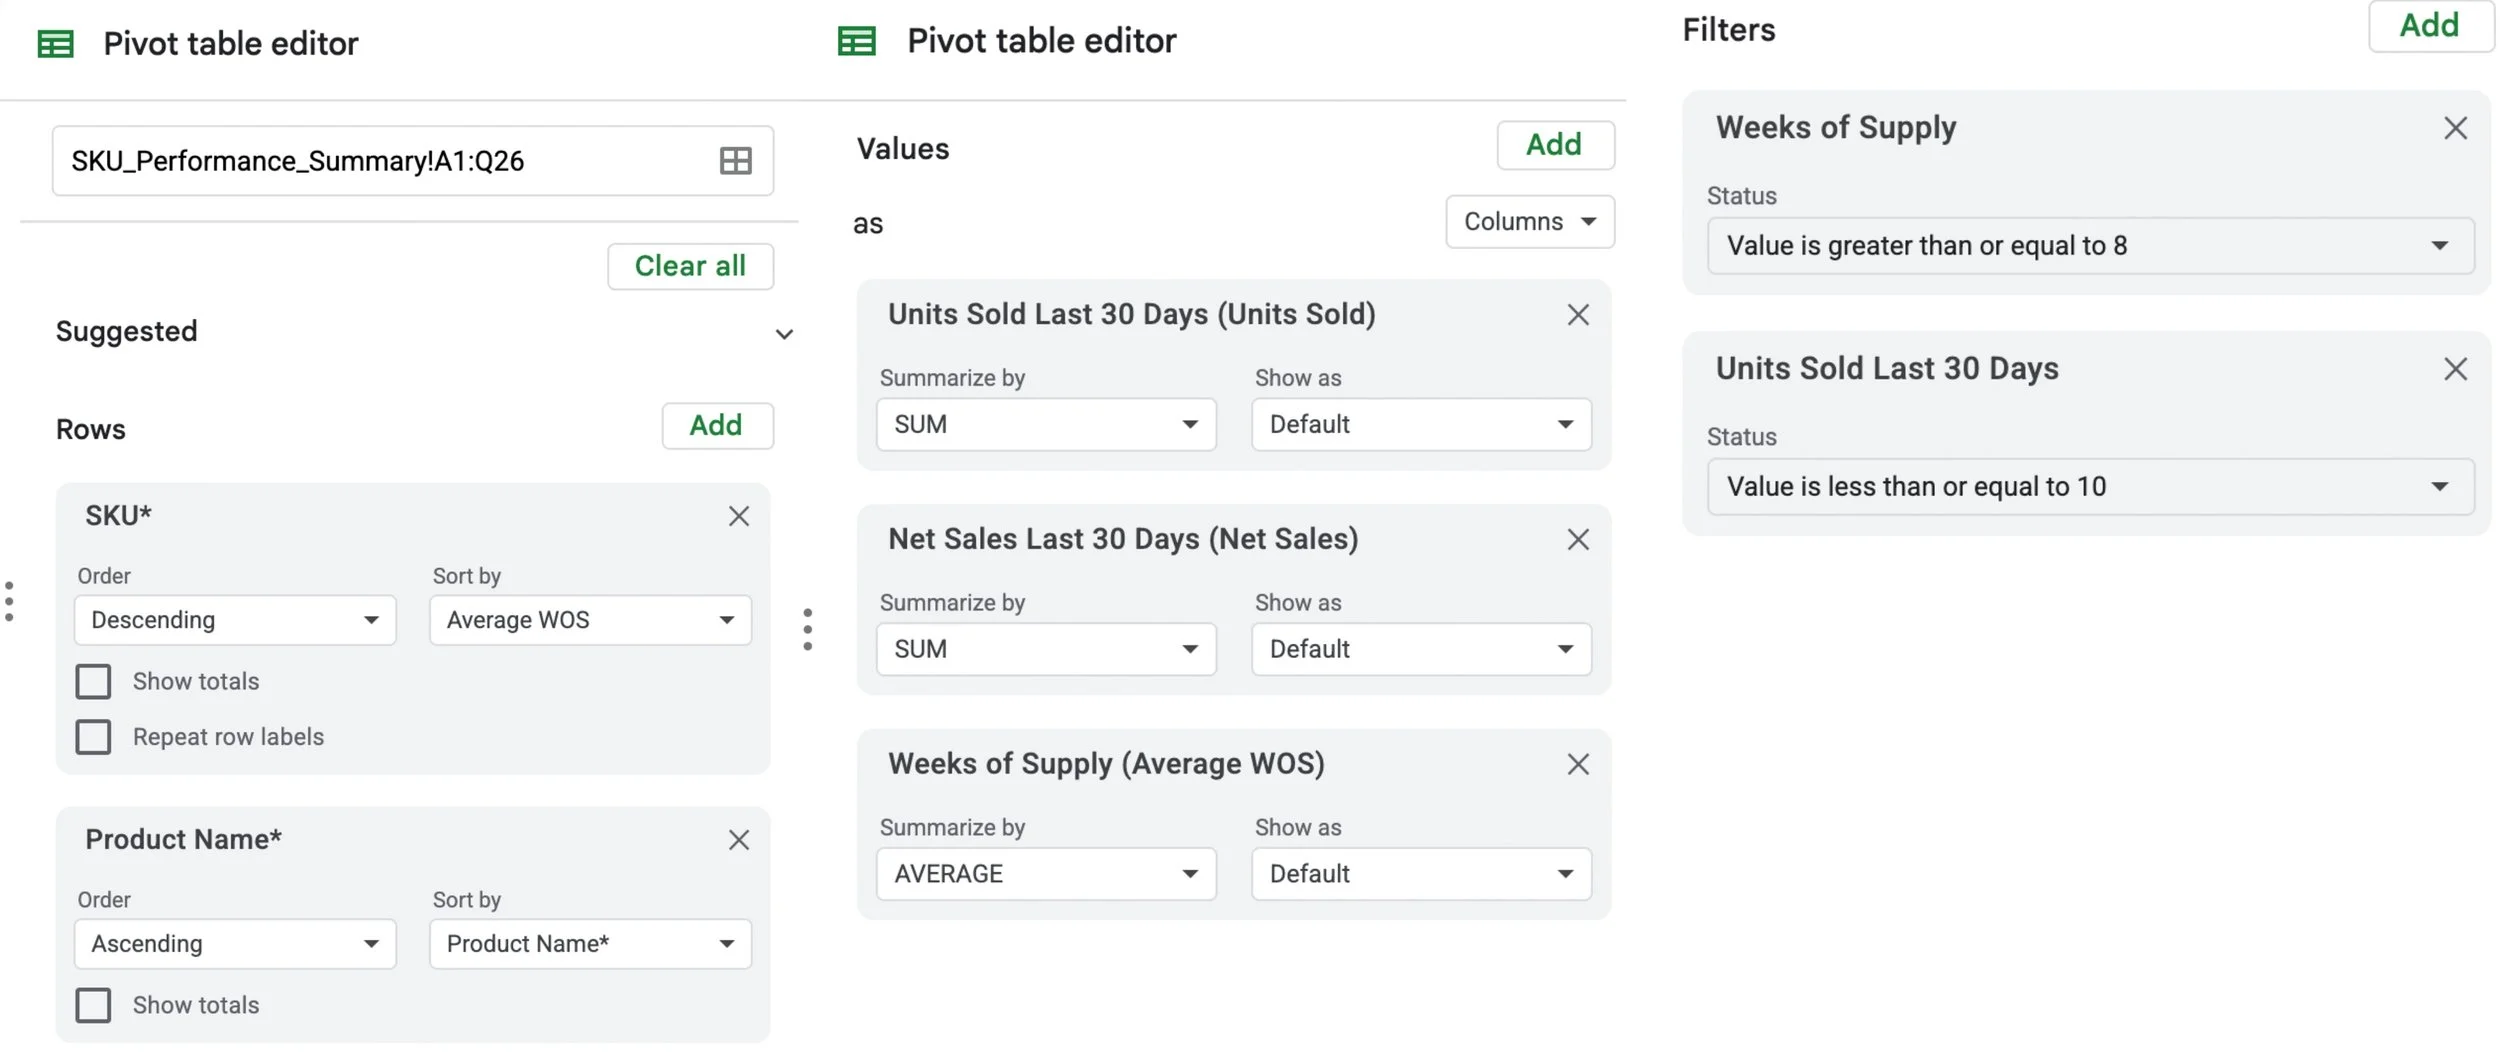
Figure 4.3a. Risk / Action SKUs (Slow Movers)
This pivot table produces an action list by filtering for low Units Sold and high Average Weeks of Supply. This highlights SKUs that may need markdowns, re-merchandising, or reduced reordering.
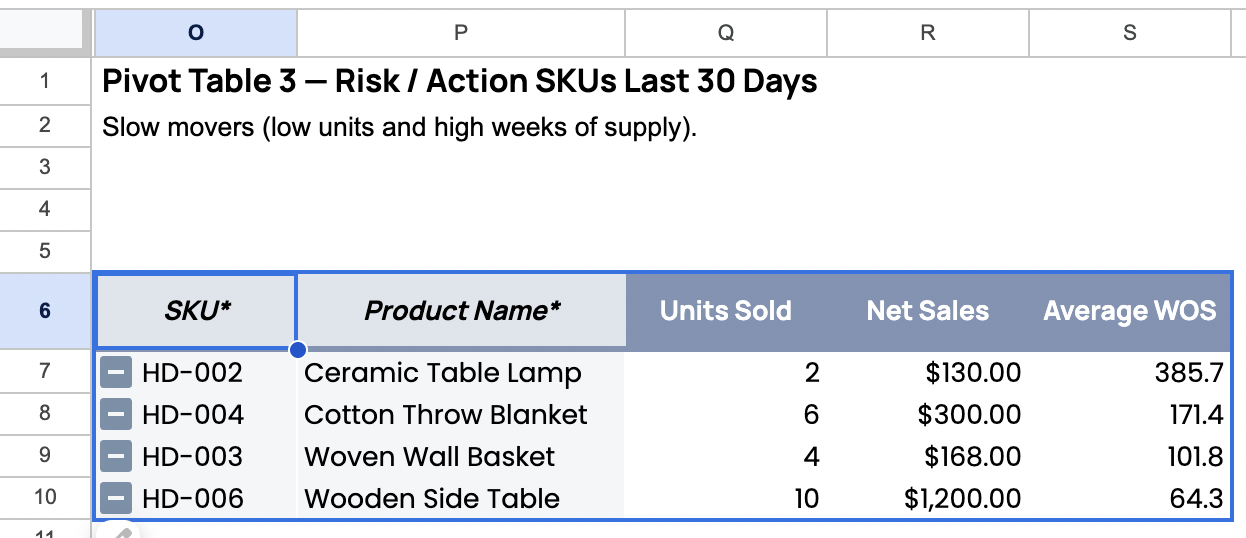
Figure 4.3b. Risk Pivot Table Filters
This view documents the exact thresholds applied in the pivot table filters (Units Sold and Average Weeks of Supply) to generate the slow-mover list consistently.
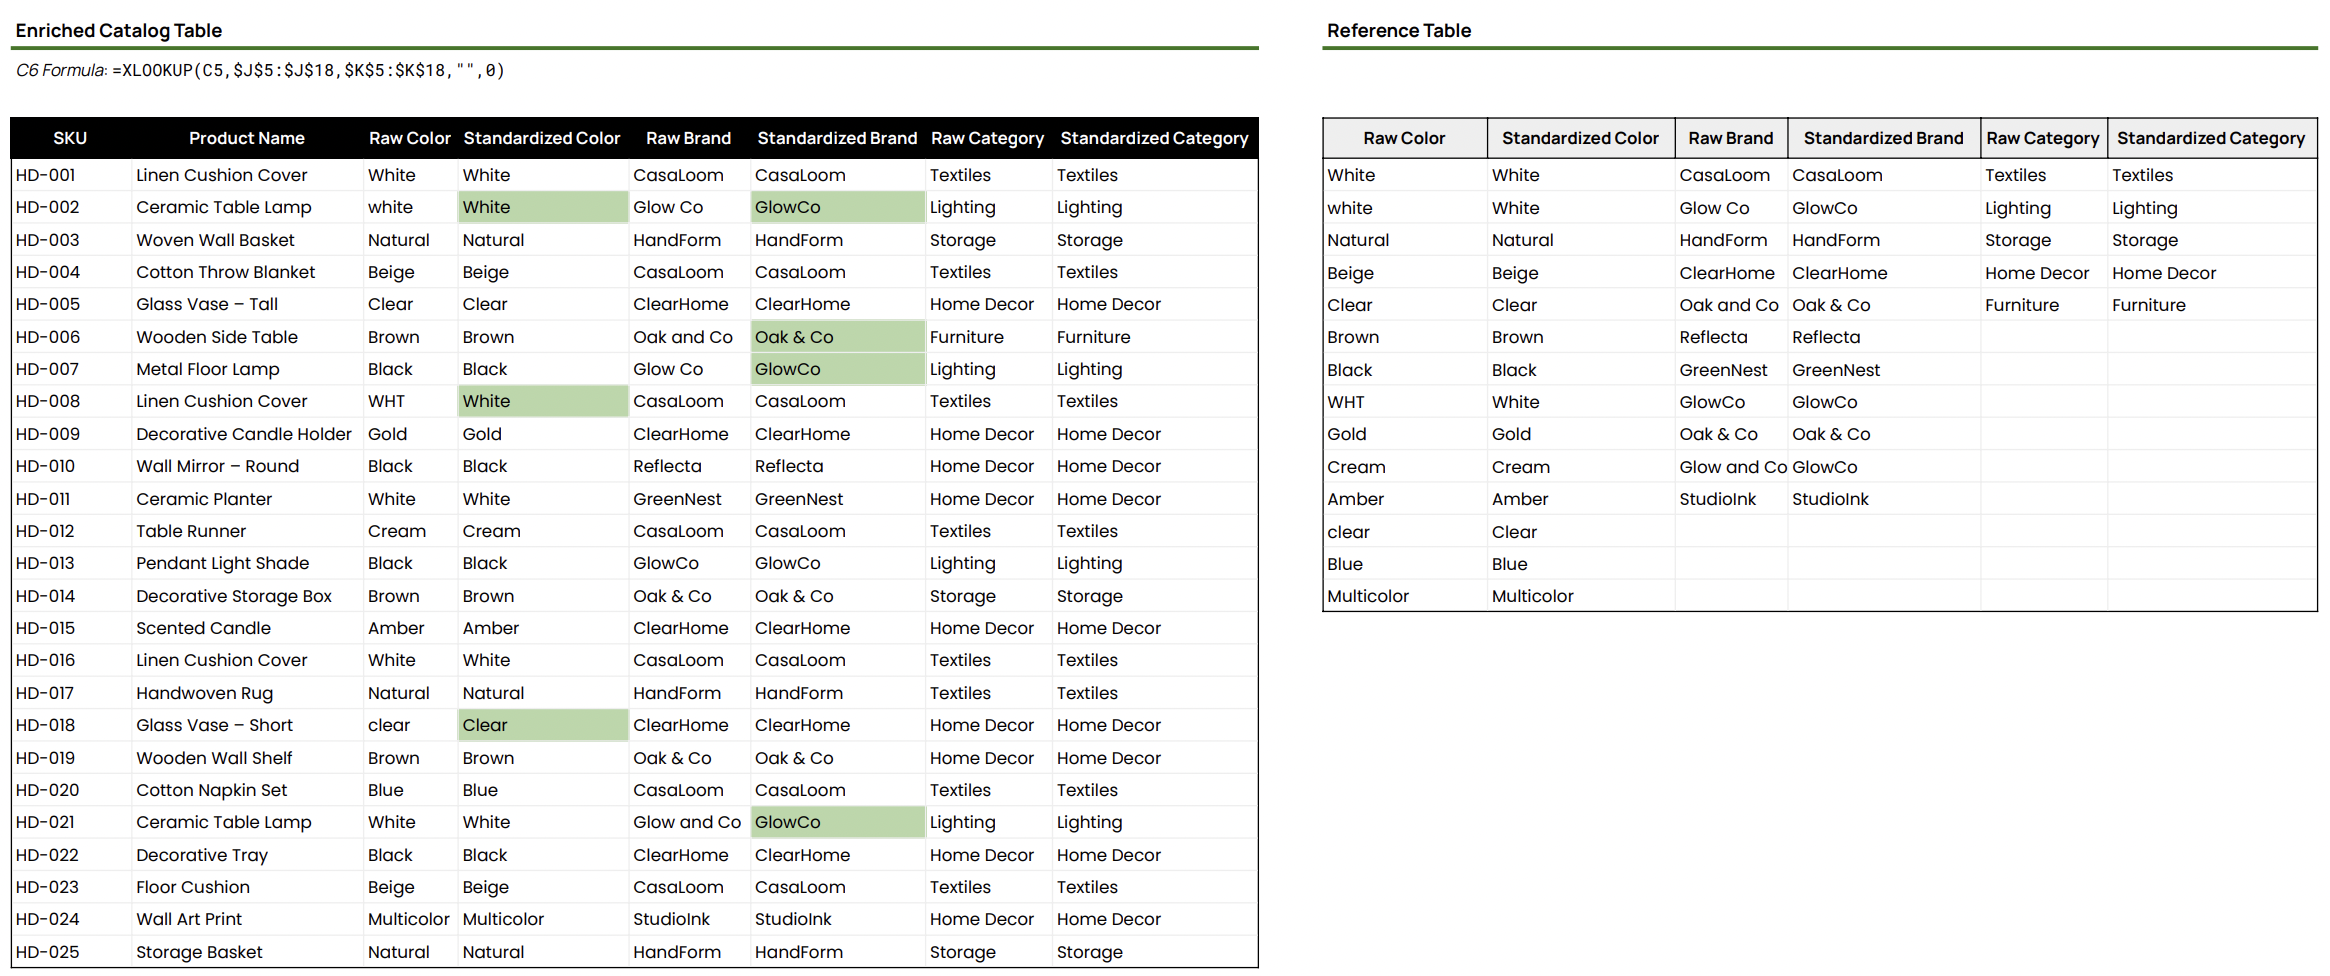
5. Catalog Value Standardization
This section shows how I standardize inconsistent catalog values using a reference mapping table and XLOOKUP. The helper view separates raw inputs from standardized outputs and highlights changed values for quick review and safe bulk updates.
Figure 5.1. Enrichment Output & Reference Mapping Tables
This view standardizes Color, Brand, and Category values (for example, “white” and “WHT” to “White,” and “Glow Co” to “GlowCo”) using a controlled reference table. Conditional formatting highlights standardized values that differ from the raw source to make review faster.
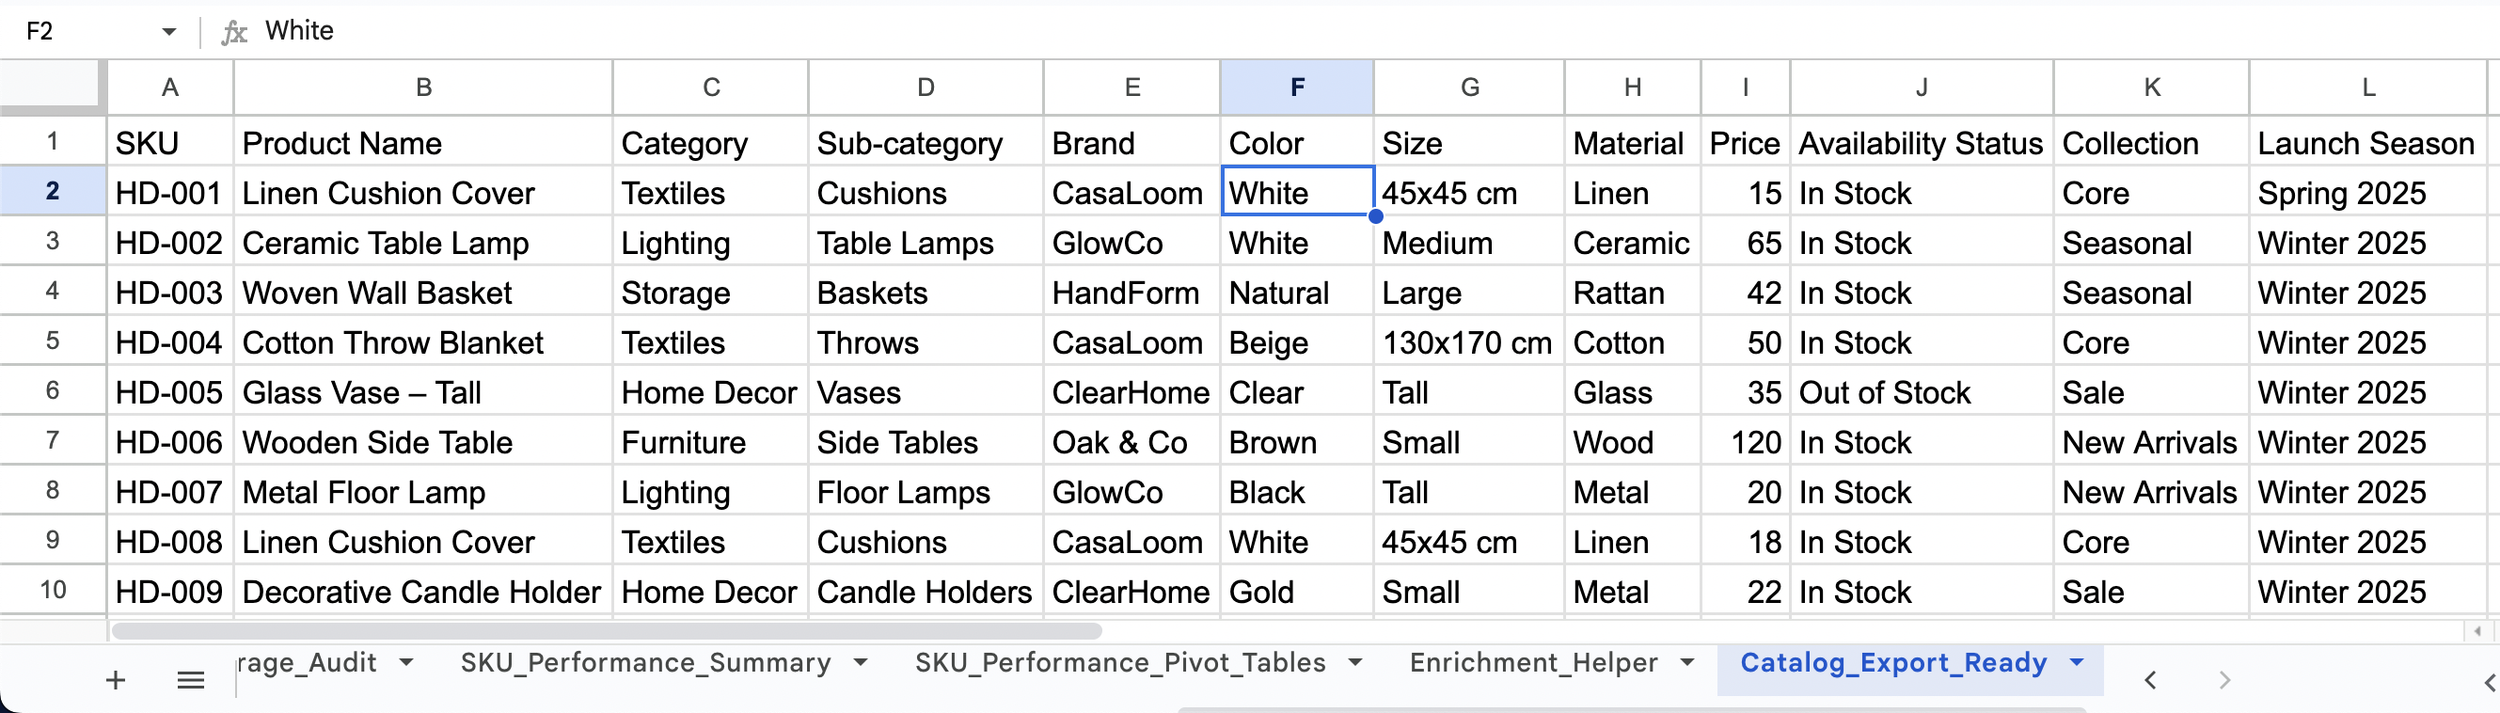
6. CSV Export
This section shows how I generate an export file for bulk updates. The export tab pulls standardized values by SKU using XLOOKUP against a controlled reference mapping table, then I convert the results to values-only to remove formulas before export.
Figure 6.1. CSV Export (Values-Only)
This export view keeps one row per SKU and uses final, standardized values (for example, Brand and Color) pulled by SKU. After validation, the sheet is frozen as values only so it can be safely exported as a CSV for platform exports without formulas or helper columns.
Conclusion
This case study demonstrates how I use Google Sheets or Excel to run practical ecommerce catalog operations end-to-end: separating raw feeds from working data, enforcing controlled inputs with reference lists, surfacing QA issues with clear checks, auditing attribute completeness by category, standardizing messy values with lookup-driven mappings, and producing values-only exports that are safe to upload across ecommerce platforms and PIM systems.
The workflow is designed for repeatability and risk reduction: controlled dropdowns prevent new bad inputs, QA flags make issues reviewable at scale, audits prioritize enrichment, pivot tables create fast performance and action views without manual sorting, and lookup-driven standardization keeps corrections consistent across the catalog. For change tracking, I rely on Google Sheets version history for granular edits and use a lightweight change log only for high-impact or bulk updates so changes stay traceable and easy to audit.